
Africa's $1.2 Trillion Question: Who Do We Owe?
In 2024, Africa's total external debt stood at $1.2 trillion. Total public debt: $2 trillion. Average debt-to-GDP: 66.8%.
But who exactly are we paying? The table breaks down our $1.15 trillion debt (2023) by creditor and what each charges us.
How did we get here? Between 2000-2023, private creditors went from 20% to 43% of our debt, while bilateral lenders dropped from 52% to 23%.
Why did we make this shift? It wasn't really a choice:
We "graduated" out of cheap money. After HIPC/MDRI debt relief (1996-2005), many African countries hit middle-income status. Good news, right? Except it made us ineligible for concessional financing. We couldn't access the cheap multilateral loans anymore.
Infrastructure couldn't wait. We needed massive, fast capital for roads, energy, ports. Eurobonds let us raise $500M-$2B in single shots - much faster than multilateral loan approvals. Paris Club couldn't provide capital at the scale and speed we needed.
The "freedom" was attractive. No IMF conditions. No structural adjustments. Just capital. Governments had full discretion on spending.
The timing seemed right (2007-2020). Global interest rates were at historic lows. We could borrow at 5-6%, not cheap, but reasonable. Investors were hungry for higher yields than developed markets offered, so demand for African bonds was strong.
This transition is normal; Latin America and Asia have undergone similar shift. But here's the problem:
In 2024, we paid $102.6 billion in debt service. We're paying 50-80% MORE than other developing regions:
Average borrowing costs (2022-23):
🔴 Africa: 11.6%
🟠 Latin America: 7.7%
🟡 Asia: 6.5%
Why the gap?
Part of it is structural. Africa's GDP is only $1.9 trillion, tiny compared to Latin America's $5-6 trillion or Asia's $42 trillion. Smaller economies = less leverage = worse negotiating power.
But there's more: Even accounting for size, there's an "Africa premium". Investors charge us more - even though our default rates are lower.
🟡 Africa Default Only: 5.5%, vs
🟠 Asia: 8.5% vs
🔴 Latin America: 13%
The question isn't just who we owe. It's why we're paying nearly double what others pay.
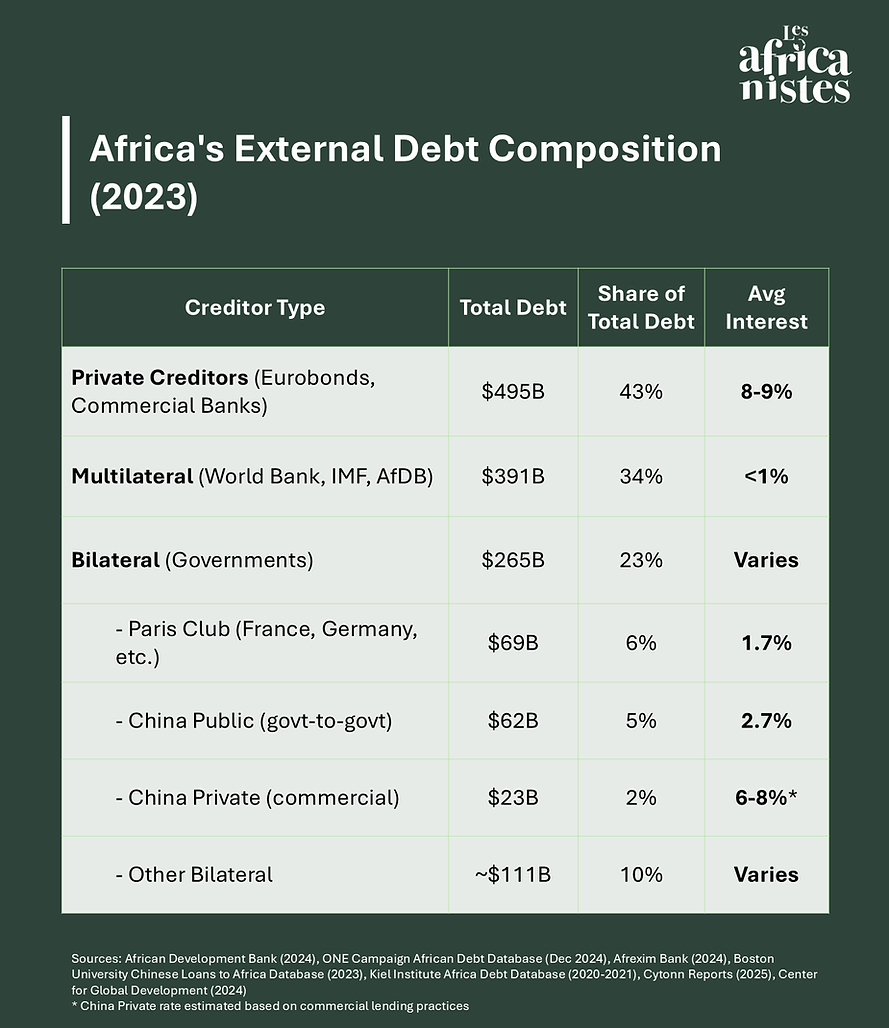
[Data In Image]
Sources: African Development Bank (2024), ONE Campaign African Debt Database (Dec 2024), Afrexim Bank (2024), Boston University Chinese Loans to Africa Database (2023), Kiel Institute Africa Debt Database (2020-2021), Cytonn Reports (2025), Center for Global Development (2024)
* China Private rate estimated based on commercial lending practices
About Les Africanistes: We are a Pan-African market intelligence and advisory platform. Follow our intelligence on African markets, connect with our expert network, or get advisory support for your expansion.
📩 Stay informed → Subscribe to Africa Intelligence
🌍 Contribute your expertise → Join Our Expert Network
💼 Expand into Africa → Book a Consultation